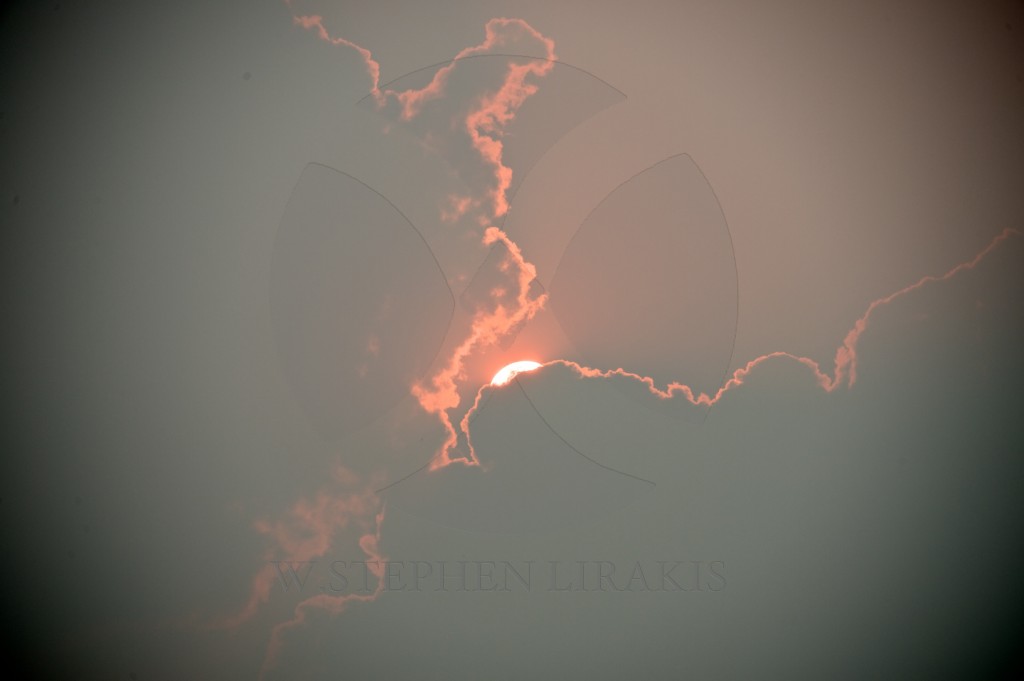
ALMOST THE LONGEST NIGHT IN HISTORY

This morning in Newport the sun was supposed to shine through a portal on the “Old Stone Mill” not to be seen again for 18.5 years.

Correction: Tonight will not be the longest night in the history of Earth. It was in 1912.

(Marjan Lazarevski)
Correction: This article originally said that, due to the rotation of the Earth gradually slowing down over time, this winter solstice would feature the longest night ever.

I got this wrong. The Earth’s rotation is gradually slowing on an extremely long timescale, but on a shorter year-to-year basis, geologic factors can alter the speed as well.

Data indicates that the rotation speed has actually sped up slightly over the past forty years, likely due to melting of ice at the poles and the resulting redistribution of the Earth’s mass. So, as far as we know, the longest night in Earth’s history likely occurred in 1912. I apologize for the error. Thanks to Steve Allen and Ryan Hardy for pointing it out.


Today, you might already know, is the winter solstice. That means for people living in the Northern Hemisphere, it’s the longest night of the year.

However, as science blogger Colin Schultz points out, tonight will also be the longest night ever.

At any location in the Northern Hemisphere, in other words, tonight’s period of darkness will be slightly longer than any other, ever — at least, since the planet started spinning right around the time it was first formed some 4.5 billion years ago.

Why this night will be the longest ever

The reason is that the rotation of the Earth is slowing over time. Every year, scientists estimate, the length of a day increases by about 15 to 25 millionths of a second.

It may be a truly tiny amount (and it means that even in your entire lifetime, the length of a day will only expand by about two milliseconds), but it forces official timekeepers to add a leap second every few years.

The main reason Earth’s rotation slowing down is the moon. Shortly after the formation of Earth, it was impacted by a planet-sized object. This enormous collision threw off the material that would eventually coalesce into the moon, and also sent Earth spinning quite rapidly.

In the four-plus billion years since, that spinning has slowed down pretty significantly (with an Earth day going from about six hours to 24 hours as a result) because of the moon’s gravity.

The moon’s gravity pulls ocean water slightly toward and away from it, causing tides. But because of the alignment of the two bodies, the resulting bulge of water is slightly ahead of the spot on Earth that’s directly under the moon.

As a result, the Earth encounters just a bit of friction from this bulge of water as it rotates, slowing it down slightly.

The phenomenon — called tidal acceleration — also allows the moon to drift slightly farther away from Earth over time. (It’s also what’s led the same face of the moon to always faces Earth as it rotates around us, and eventually, if things went on long enough, the same face of Earth would always face the moon as well, a phenomenon called tidal locking.)

There are a few other things that contribute to Earth’s slowing down, but their contributions are minor. One is that the moon’s gravity similarly causes Earth’s crust to flex, like its water, leading to some friction as well.

Why winter solstice is the longest night of the year

This one is much simpler. The Earth orbits around the sun on a tilted axis, so sometimes, the Northern Hemisphere gets more exposure to sunlight over the course of a day, and sometimes, the Southern Hemisphere does. This is what accounts for the changing of the seasons.

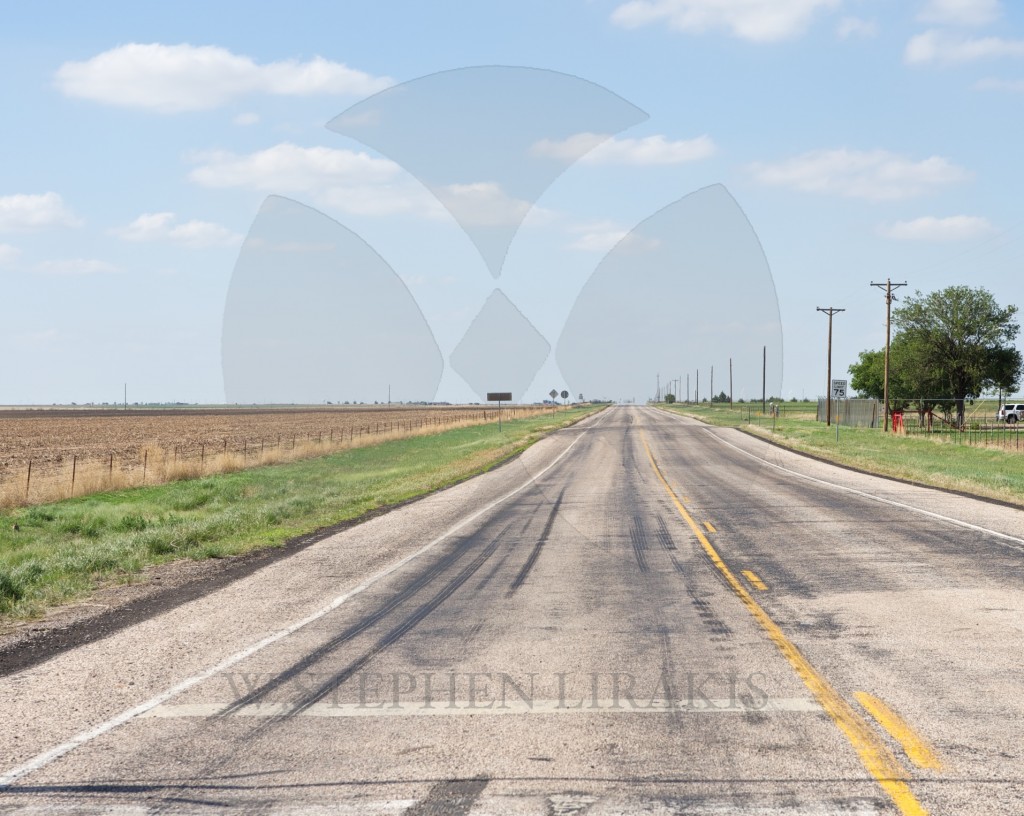
LOOKING FOR AMERICA (UNEDITED)

Quickly done and I should wait to publish it; however I am rather pleased with the way it is coming together. I will post a finished copy later.

RAIN EVENT

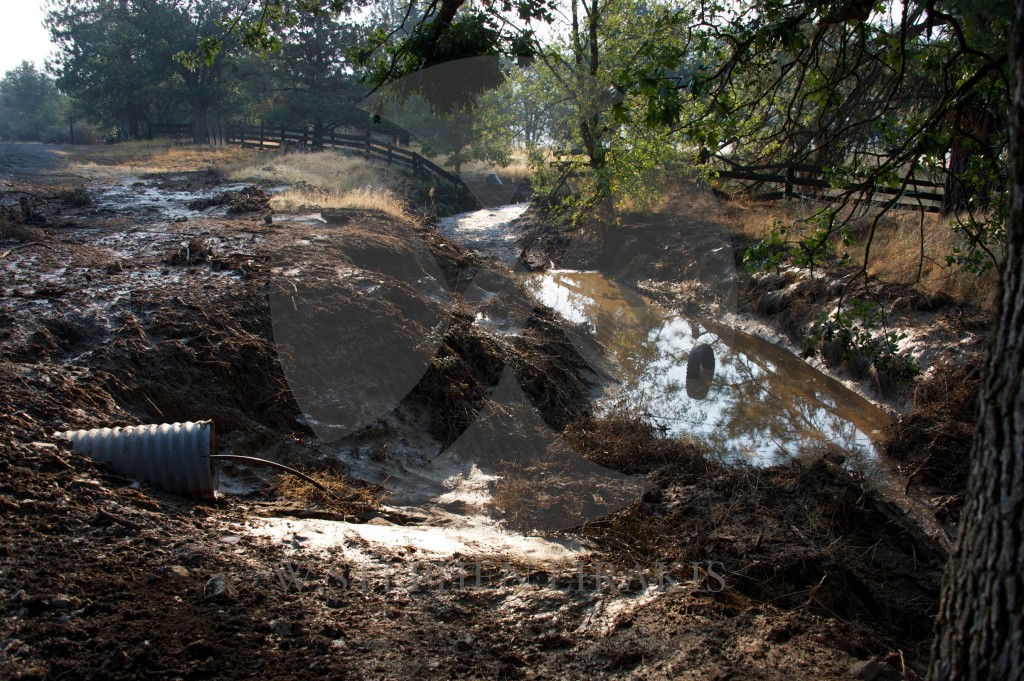
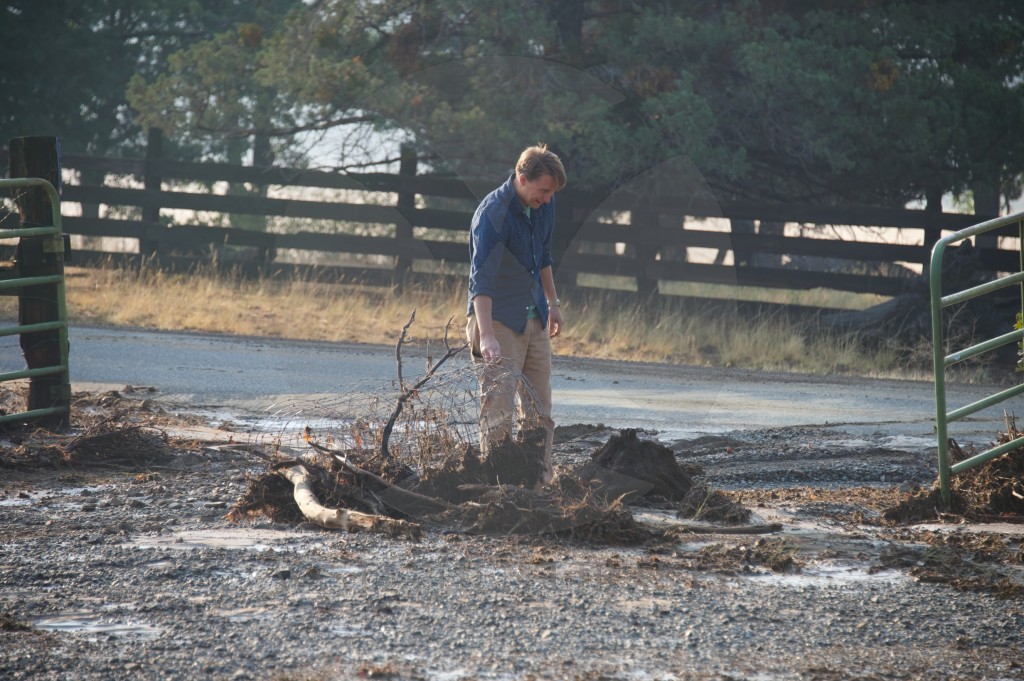
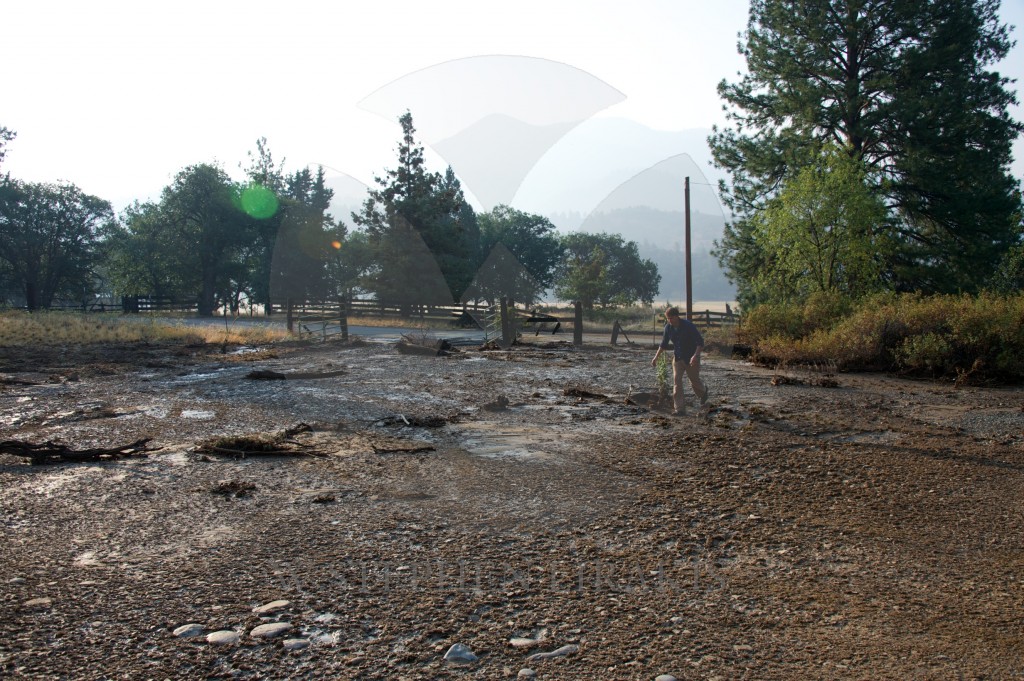
In the morning I spoke to the man clearing the roads of mud that washed down the mountains the night before. We had a thunderstorm and 3 inches of rain in a very short period of time; which fell on parched ground. Unfortunately not on the forest fire which continues to burn unchecked.

CLOGGED GULLY
CLOGGED GULLY
DEBRIS
DEBRIS
WASHED OUT
WASHED OUT
DRAGONFLY
DRAGONFLY
STORM CLOUDS
STORM CLOUDS

WATER, WATER

What’s your favorite river? Here’s a story about mine

By John D. Sutter, CNN

updated 9:32 AM EDT, Sat July 5, 2014

Me and John Dye, of Rivers for Change, at the Golden Gate Bridge on Friday.

STORY HIGHLIGHTS

  1. John Sutter on Friday completed a three-week trip down the San Joaquin River
  2. The river was named the most endangered in the country by an advocacy group
  3. Readers voted for Sutter to write about rivers as part of his Change the List project
  4. The San Joaquin travels through rich agricultural land in California — and it runs dry

Editor’s note: John D. Sutter is a columnist for CNN Opinion and creator of CNN’s Change the List project. Follow him on Twitter, Facebook or Google+. E-mail him at ctl@cnn.com. The opinions expressed in this commentary are solely those of the author.

San Francisco (CNN) — Three weeks and about 400 miles ago, I started a trip down the “most endangered” river in the United States, California’s San Joaquin. The underloved river is born in the Sierra Nevada and snakes across one of the most productive agricultural regions in the world, California’s Central Valley.

I finished that journey — which mostly involved kayaking, but also a fair bit of walking, since the San Joaquin runs dry for about 40 miles — on Friday beneath the Golden Gate Bridge here in San Francisco.

It was a moment I’ll always remember: that behemoth, cardinal-red bridge towering overhead, clanging in the wind, the distant roar of traffic, water rushing through a 1.7-mile channel that drains about 40% of this country-sized state’s land area. The ocean tossed the kayak around like a piece of dough.

John D. Sutter

Thirty-five mph winds seared salt water to my face, and tears of joy ran down my cheeks. It was thrilling but also bittersweet. I knew that not a single drop of San Joaquin water made it to the bridge, which should be the end of the river. All of it — 100% — is diverted for a variety of human uses, mostly for farming.

As I crossed under the bridge, which separates the San Francisco Bay from the Pacific Ocean, my thoughts were as choppy as the water. But between “Don’t flip!” and “ROCK!” I looked up at the bridge and remembered a moment from my June 11 hike at the headwaters of the San Joaquin.

I could hear the river rumbling down in a valley to the left on that mountain trail, and I said something to my hiking companion, Darin McQuoid — a pro kayaker who goes careening off 80-foot waterfalls like it’s no big thing — about how, to me, the river sounded like a highway.

No, he said, it’s the opposite. Highways sound like rivers.

San Joaquin River

That’s so true. And it really clicked for me in that moment. After three weeks on the river, I was finally starting to see things from the water’s perspective.

Rivers, of course, are the original highways. The roaring traffic above on the Golden Gate reminded me of the San Joaquin in its early, healthy stretches.

But for most of us, traffic is far more familiar.

We’ve become a people disconnected from the water. We don’t know rivers. We don’t know where they start, where they’re going, when they’re full, why they’re dry. We don’t know enough to understand why — long after the Huck Finn era — they still shape our lives, they’re still worthy of our attention and unyielding respect

I hope this trip is part of a much broader effort to change that. To tilt our collective thinking toward a focus on water, and its great shepherds, the rivers.

I could go on for MANY more paragraphs about the journey — about the farmers, bird-lovers, migrant workers, fish biologists, dam operators, boat nuts and barefoot skiers I met along the way. I’ll do that at a later date as part of our Change the List project. For now, I wanted to say a heartfelt thank you to all of the readers who followed my voyage down the San Joaquin so diligently — and helpfully — on social media. Some of you sent me scientific reports about locations I was passing; others actually met me out on the river to share a piece of your story.

Two science teachers brought me a burrito beneath a bridge. One woman stood at the edge of her family farm for two hours waiting for me to pass. For all of that I am forever grateful. It’s incredible that you cared about this story so deeply. You were an essential part of it. You shaped my path.

So, I’ll say it again, since I don’t enough: Thank you.

You readers are awesome.

AND: I do have a favor to ask. I’d like to ask you to turn your gaze toward rivers, too. CNN iReport is inviting you to send in photos, videos or essays about your favorite rivers. It could be a river you saw on vacation or one in your backyard. Tell us a little bit about it and it may be featured as part of a list of “our favorite rivers.”

Here’s a page with instructions on how to do it.

I know which river I’ll pick. Certainly the San Joaquin.

Stay tuned for more reporting on America’s “most endangered” river in coming weeks, and thank you again for being such an integral part of this adventure.

“ARTHUR”, FIRST NAMED STORM OF THE SEASON

CLICK HERE FOR THE LATEST DEVELOPEMENTS

Tropical Storm ARTHUR


Home   Public Adv   Fcst Adv   Discussion   Wind Probs   Graphics   Archive

US Watch/Warning  


Hurricane Wind Speed Probability
Hurricane Wind
Speed Probability
50-knot Wind Speed Probability
50-knot Wind
Speed Probability
34-knot Wind Speed Probability
Trop Storm Wind
Speed Probability
Wind History
Wind
History
Google Maps API Warnings and Track Forecast Cone
Warnings/Cone
Interactive Map
Warnings and 5-Day Cone
Warnings/Cone
Static Images
Surface Wind Field
Warnings and
Surface Wind
Mariner's 1-2-3 Rule
Mariner’s
1-2-3 Rule

Hurricane Force Wind Speed Probabilities – 120 Hours
Select a Future Forecast Time Below:
0 12 24 36 48 60 72 84 96 108 120 hours Loop

Click image to zoom in – Download GIS data: 0.1 degree .shp  0.5 degree .shp [Image of probabilities of hurricane force winds]
Click Here for a Printer Friendly Graphic

About this product:

Note: The time of the tropical cyclone’s center location at the bottom of the graphic will be 3 hours earlier than the time of the current advisory. The forecast cycle for each advisory begins 3 hours prior to the issuance of the advisory products.

These graphics show probabilities of sustained (1-minute average) surface wind speeds equal to or exceeding 64 kt…74 mph (hurricane force). These wind speed probability graphics are based on the official National Hurricane Center (NHC) track, intensity, and wind radii forecasts, and on NHC forecast error statistics for those forecast variables during recent years. Each graphic provides cumulative probabilities that wind speeds of at least 74 mph will occur during cumulative time periods at each specific point on the map. The cumulative periods begin at the start of the forecast period and extend through the entire 5-day forecast period at cumulative 12-hour intervals (i.e., 0-12 h, 0-24 h, 0-36 h, … , 0-120 h). An individual graphic is produced for each cumulative interval, and the capability to zoom and animate through the periods is provided. To assess the overall risk of experiencing winds of at least 74 mph at any location, the 120-h graphics are recommended.

These probabilities will be updated by the NHC with each advisory package for all active tropical cyclones in the Atlantic and eastern North Pacific basins. While separate graphics are focused on each individual tropical cyclone, probabilities resulting from more than one active tropical cyclone may be seen on each graphic.

Additionally, these probability products are available on the National Weather Service’s National Digital Forecast Database (NDFD) graphical tropical webpage.

The previously provided strike probability product (discontinued after 2005) conveyed the chances of a “close” approach of the center of the cyclone. However, these new probability products are about the weather. That is, these cumulative wind speed probabilities provide the chances that wind speeds of at least 74 mph will occur at individual locations. The cumulative probabilities can answer the question, “What are the chances that sustained winds of tropical storm or hurricane force will occur at any specific location?” This can also help one answer the question, “Do I need to take certain actions to prepare?” A companion product, the wind speed probability text product, will also be issued and updated with each advisory package. That product is recommended to more easily assess when winds of each threshold are most likely to start at any specific location, helping to answer the question, “How long do I have to prepare?” Overall, these probabilities provide users with information that can enhance their ability to make preparedness decisions specific to their own situations.

It is important for users to realize that wind speed probabilities that might seem relatively small at their location might still be quite significant, since they indicate that there is a chance that a damaging or even extreme event could occur that warrants preparations to protect lives and property.

There is never a good time for misfortune, and dangerous weather is no exception to this statement. It is unlucky that “Arthur” is arriving for the 4th of July week, but is there a better time?


HURRICANE SEASON

         In its 2014 Atlantic hurricane season outlook, the National Oceanic and Atmospheric Administration’s (NOAA) Climate Prediction Center is forecasting a near-normal or below-normal season.

The main driver of this year’s outlook is the anticipated development of El Niño this summer. El Niño causes stronger wind shear, which reduces the number and intensity of tropical storms and hurricanes. El Niño can also strengthen the trade winds and increase the atmospheric stability across the tropical Atlantic, making it more difficult for cloud systems coming off of Africa to intensify into tropical storms.

The outlook calls for a 50 percent chance of a below-normal season, a 40 percent chance of a near-normal season, and only a 10 percent chance of an above-normal season. For the six-month hurricane season, which begins June 1, NOAA predicts a 70 percent likelihood of 8 to 13 named storms (winds of 39 mph or higher), of which 3 to 6 could become hurricanes (winds of 74 mph or higher), including 1 to 2 major hurricanes (Category 3, 4 or 5; winds of 111 mph or higher).

These numbers are near or below the seasonal averages of 12 named storms, six hurricanes and three major hurricanes, based on the average from 1981 to 2010. The Atlantic hurricane region includes the North Atlantic Ocean, Caribbean Sea and Gulf of Mexico.

“Thanks to the environmental intelligence from NOAA’s network of earth observations, our scientists and meteorologists can provide life-saving products like our new storm surge threat map and our hurricane forecasts,” said Kathryn Sullivan, Ph.D., NOAA administrator. “And even though we expect El Niño to suppress the number of storms this season, it’s important to remember it takes only one land falling storm to cause a disaster.”

Gerry Bell, Ph.D., lead seasonal hurricane forecaster with NOAA’s Climate Prediction Center, said the Atlantic – which has seen above-normal seasons in 12 of the last 20 years – has been in an era of high activity for hurricanes since 1995. However, this high-activity pattern is expected to be offset in 2014 by the impacts of El Niño, and by cooler Atlantic Ocean temperatures than we’ve seen in recent years. – NOAA, read on

National Hurricane Preparedness Week is May 25-31. NOAA offers hurricane preparedness tips, along with video and audio public service announcements in both English and Spanish, featuring NOAA hurricane experts and the FEMA Administrator atwww.hurricanes.gov/prepare

MESSAGE IN A BOTTLE

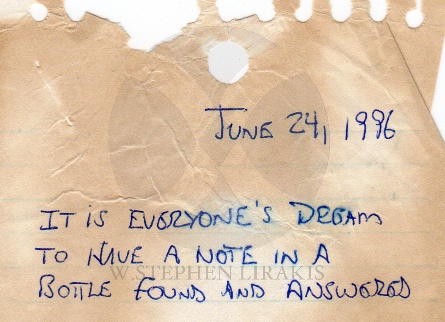
MY MESSAGE
MY MESSAGE

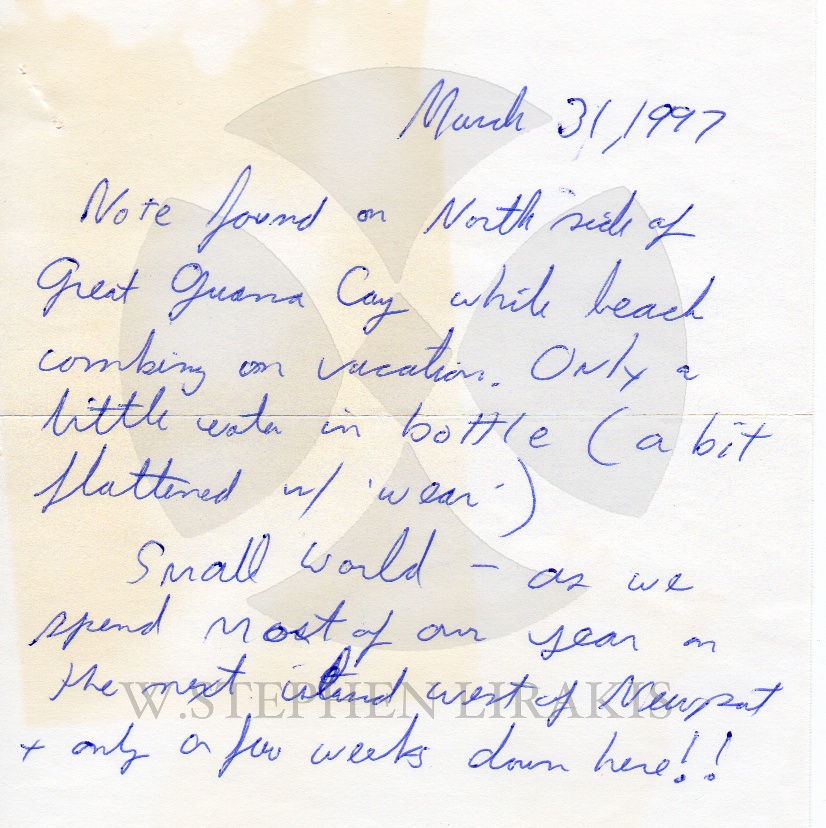
I had my own experience with a message in a bottle. I find it is a rather profound event in life representative of so many thoughts and feelings.


THE REPLY
THE REPLY

101-year-old bottle message: Baltic find reveals my roots, says granddaughter

Berlin resident Angela Erdmann speaks of unknown grandfather who threw bottle but died six years before she was born
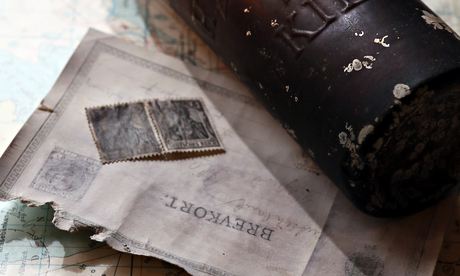
Richard Platz's message

Richard Platz’s message, which he threw into the sea in 1913, when he was 20 years old. Photograph: Uwe Paesler/EPA

Angela Erdmann never knew her grandfather. He died in 1946, six years before she was born. But on Tuesday she described the extraordinary moment when she received a message in a bottle 101 years after he had lobbed it into the Baltic Sea.

Thought to be the world’s oldest message in a bottle, it was presented to Erdmann by the museum that is now exhibiting it in Germany.

“It was very surprising,” Erdmann, 62, said, recalling how she found out about the bottle. “A man stood in front of my door and told me he had post from my grandfather. He then told me that a message in a bottle was found and that the name that was on the card was that of my grandfather.”

Her visitor was a genealogical researcher who had managed to track her down in Berlin after the letter was given to the International Maritime Museum in the northern port city of Hamburg.

The brown beer bottle, which had been in the water for 101 years, was found in the catch of Konrad Fischer, a fisherman, who had been out in the Baltic Sea off the northern city of Kiel last month.

Holger von Neuhoff, curator for ocean and science at the museum said this bottled message was the oldest he had come across. “There are documents that have been found without the bottle that are older and are in the museum,” he said. “But with the bottle and the document, this is certainly the oldest at the moment. It is in extremely good condition.”

Researchers believe Erdmann’s grandfather, Richard Platz, threw the bottle in the sea while on a hike with a nature appreciation group in 1913. He was 20 years old at the time.

Much of the postcard was indecipherable, although the address in Berlin on the front of the card was legible, as was the author’s polite request that the note be sent by the finder to his home address.

“He also included two stamps from that time that were also in the bottle, so the finder would not incur a cost,” Erdmann said. “But he had not thought it would take 101 years.”

She said she was moved by the arrival of the message, although she had not known her grandfather because he died, at the age of 54, six years before she was born.

“I knew very little about my grandfather, but I found out that he was a writer who was very open minded, believed in freedom and that everyone should respect each other,” she said. “He did a lot for the young and later travelled with his wife and two daughters. It was wonderful because I could see where my roots came from.”

Like her grandfather, Erdmann said, she also liked culture and travelling around the world. She described herself as open minded, too. “What he taught his two daughters, my mother taught me and I have then given to my sons,” she said.

Despite her joy at receiving the bottled message, she said, however, that she hoped others would not repeat what her grandfather had done and throw bottles with messages into the sea. “Today the sea is so full of so many bottles and rubbish, that more shouldn’t be thrown in there,” she said.

The message and the bottle will be on display at Hamburg’s maritime museum until the beginning of May after which experts will attempt to decipher the rest of the text. It is not clear what will then happen to the bottle, but Erdmann hopes it will stay at the museum.

“We want to make a few photos available to put with the bottle and give it a face, so visitors can see the young man who threw the bottle into the water,” she said.

WINTER ON THE GREAT LAKES


THIS POST IS FROM “SAILING ANARCHY”


IMG_1676


 Tens of thousands of Chicago Mack crews will know what this landmark is even if they’ve never seen it look like this.  Check out this story of a recent hike – the first attempt in some 40 years – from Glen Arbor, MI to North Manitou Island.

On Thursday, March 6th, 2014, we attempted something that hasn’t been done for 40 years: to hike the treacherous ice across the Manitou Passage to the islands 8 miles out.

In the 1970’s, Bob’s father and two brothers left the shore in Glen Arbor early one morning to attempt the crossing. They were cut off by open water a mile from South Manitou. Their hike took so much longer than planned that Bob’s mother called the Coast Guard in panic! Having heard his father and brother tell stories of the adventure, Bob has been waiting for his chance to hike to the Manitous for decades.

The winter of 2013-14 has been one of the most severe in living memory. It has seen temperatures plunging to -20°F, enormous amounts of snow, polar vortices, and fierce storms. The near record-level ice coverage on Lake Michigan has been a big part of the story, as have the amazing ice caves along the Leelanau shoreline.  All this cold weather and ice build-up allowed us to attempt such an adventurous (some would say foolhardy!) hike.