


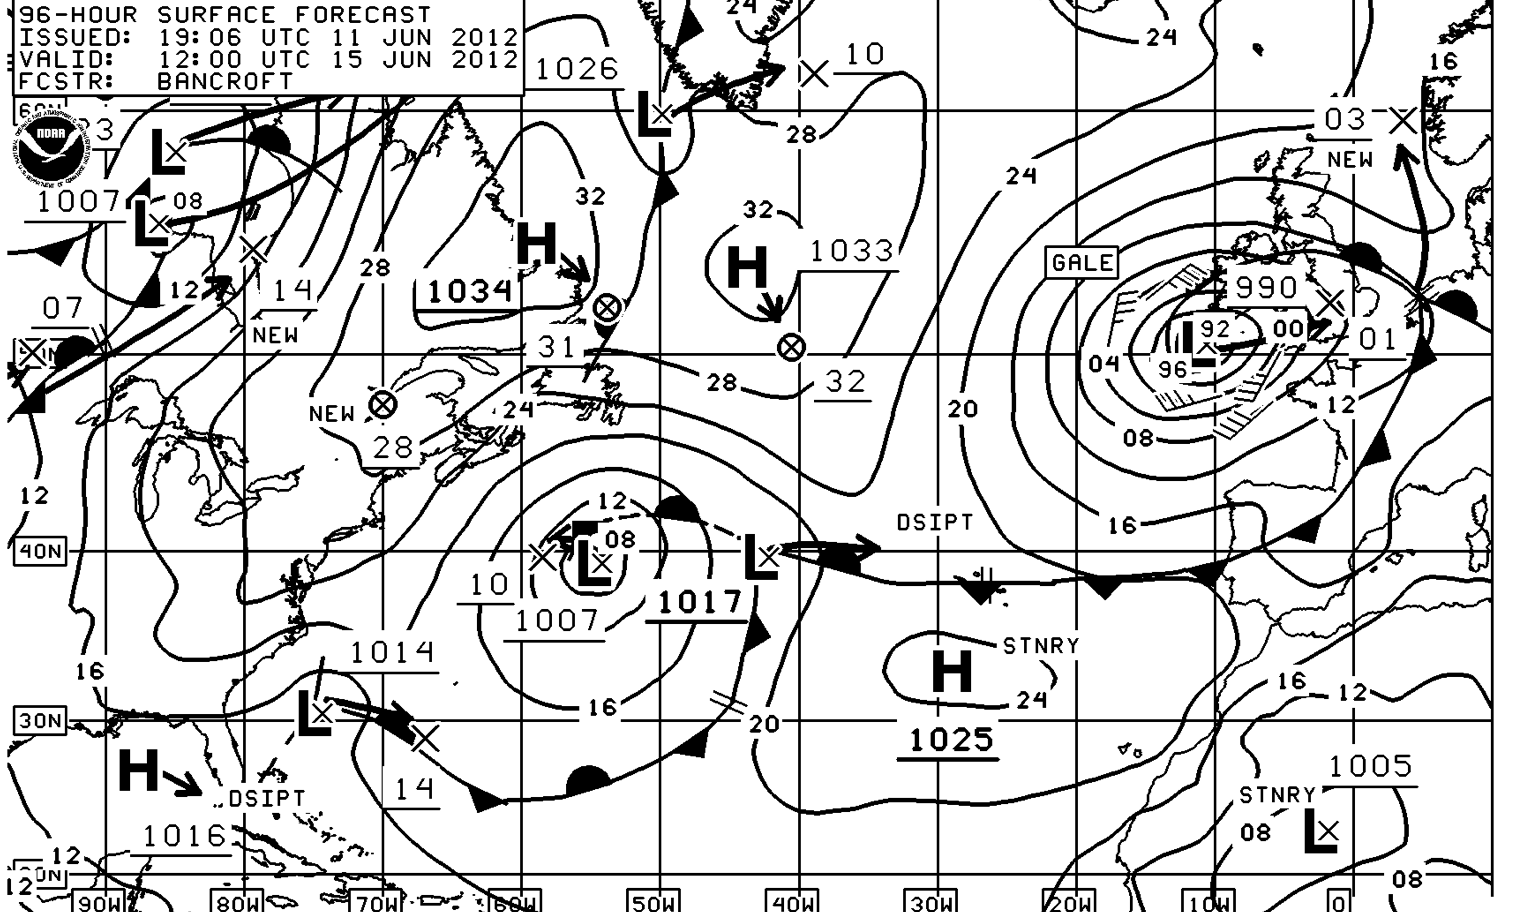
Weather has a profound effect on everything we do. the way we dress, what we decide to do in a day. Where is decide to do it. How we decide to do it. Whether we like it or not weather is a primary concern.
Walking in Paris today in the rain changed everything. I was more protective of my camera, which in turn changed the way I took photographs; or if I would even choose to take one.


|
Hurricane Wind Speed Probability |
50-knot Wind Speed Probability |
Trop Storm Wind Speed Probability |
Wind History |
|
Warnings/Cone Interactive Map |
Warnings/Cone Static Images |
Warnings and Surface Wind |
Mariner’s 1-2-3 Rule |
|
![[Image of probabilities of hurricane force winds]](http://www.nhc.noaa.gov/storm_graphics/AT01/refresh/AL0114_PROB64_F120_sm2+gif/114756.gif)
Note: The time of the tropical cyclone’s center location at the bottom of the graphic will be 3 hours earlier than the time of the current advisory. The forecast cycle for each advisory begins 3 hours prior to the issuance of the advisory products.
These graphics show probabilities of sustained (1-minute average) surface wind speeds equal to or exceeding 64 kt…74 mph (hurricane force). These wind speed probability graphics are based on the official National Hurricane Center (NHC) track, intensity, and wind radii forecasts, and on NHC forecast error statistics for those forecast variables during recent years. Each graphic provides cumulative probabilities that wind speeds of at least 74 mph will occur during cumulative time periods at each specific point on the map. The cumulative periods begin at the start of the forecast period and extend through the entire 5-day forecast period at cumulative 12-hour intervals (i.e., 0-12 h, 0-24 h, 0-36 h, … , 0-120 h). An individual graphic is produced for each cumulative interval, and the capability to zoom and animate through the periods is provided. To assess the overall risk of experiencing winds of at least 74 mph at any location, the 120-h graphics are recommended.
These probabilities will be updated by the NHC with each advisory package for all active tropical cyclones in the Atlantic and eastern North Pacific basins. While separate graphics are focused on each individual tropical cyclone, probabilities resulting from more than one active tropical cyclone may be seen on each graphic.
Additionally, these probability products are available on the National Weather Service’s National Digital Forecast Database (NDFD) graphical tropical webpage.
The previously provided strike probability product (discontinued after 2005) conveyed the chances of a “close” approach of the center of the cyclone. However, these new probability products are about the weather. That is, these cumulative wind speed probabilities provide the chances that wind speeds of at least 74 mph will occur at individual locations. The cumulative probabilities can answer the question, “What are the chances that sustained winds of tropical storm or hurricane force will occur at any specific location?” This can also help one answer the question, “Do I need to take certain actions to prepare?” A companion product, the wind speed probability text product, will also be issued and updated with each advisory package. That product is recommended to more easily assess when winds of each threshold are most likely to start at any specific location, helping to answer the question, “How long do I have to prepare?” Overall, these probabilities provide users with information that can enhance their ability to make preparedness decisions specific to their own situations.
It is important for users to realize that wind speed probabilities that might seem relatively small at their location might still be quite significant, since they indicate that there is a chance that a damaging or even extreme event could occur that warrants preparations to protect lives and property.
There is never a good time for misfortune, and dangerous weather is no exception to this statement. It is unlucky that “Arthur” is arriving for the 4th of July week, but is there a better time?
The Earth Wind Map is an amazing project to visualize global weather conditions carried out by Tokyo based software engineer Cameron Beccario, resulting in a beautifully mesmerising depiction of the earth’s winds. Weather data is produced by the Global Forecast System (GFS), operated by the US National Weather Service. Forecasts are produced four times daily and are up-to-date, providing an astonishing picture of our planet and its winds.
See the storms that have ravaged England and the Northeast.


The days are noticeably longer so despite the bitter cold hope is in the air. This is not quite time lapse photography, but the point is there.
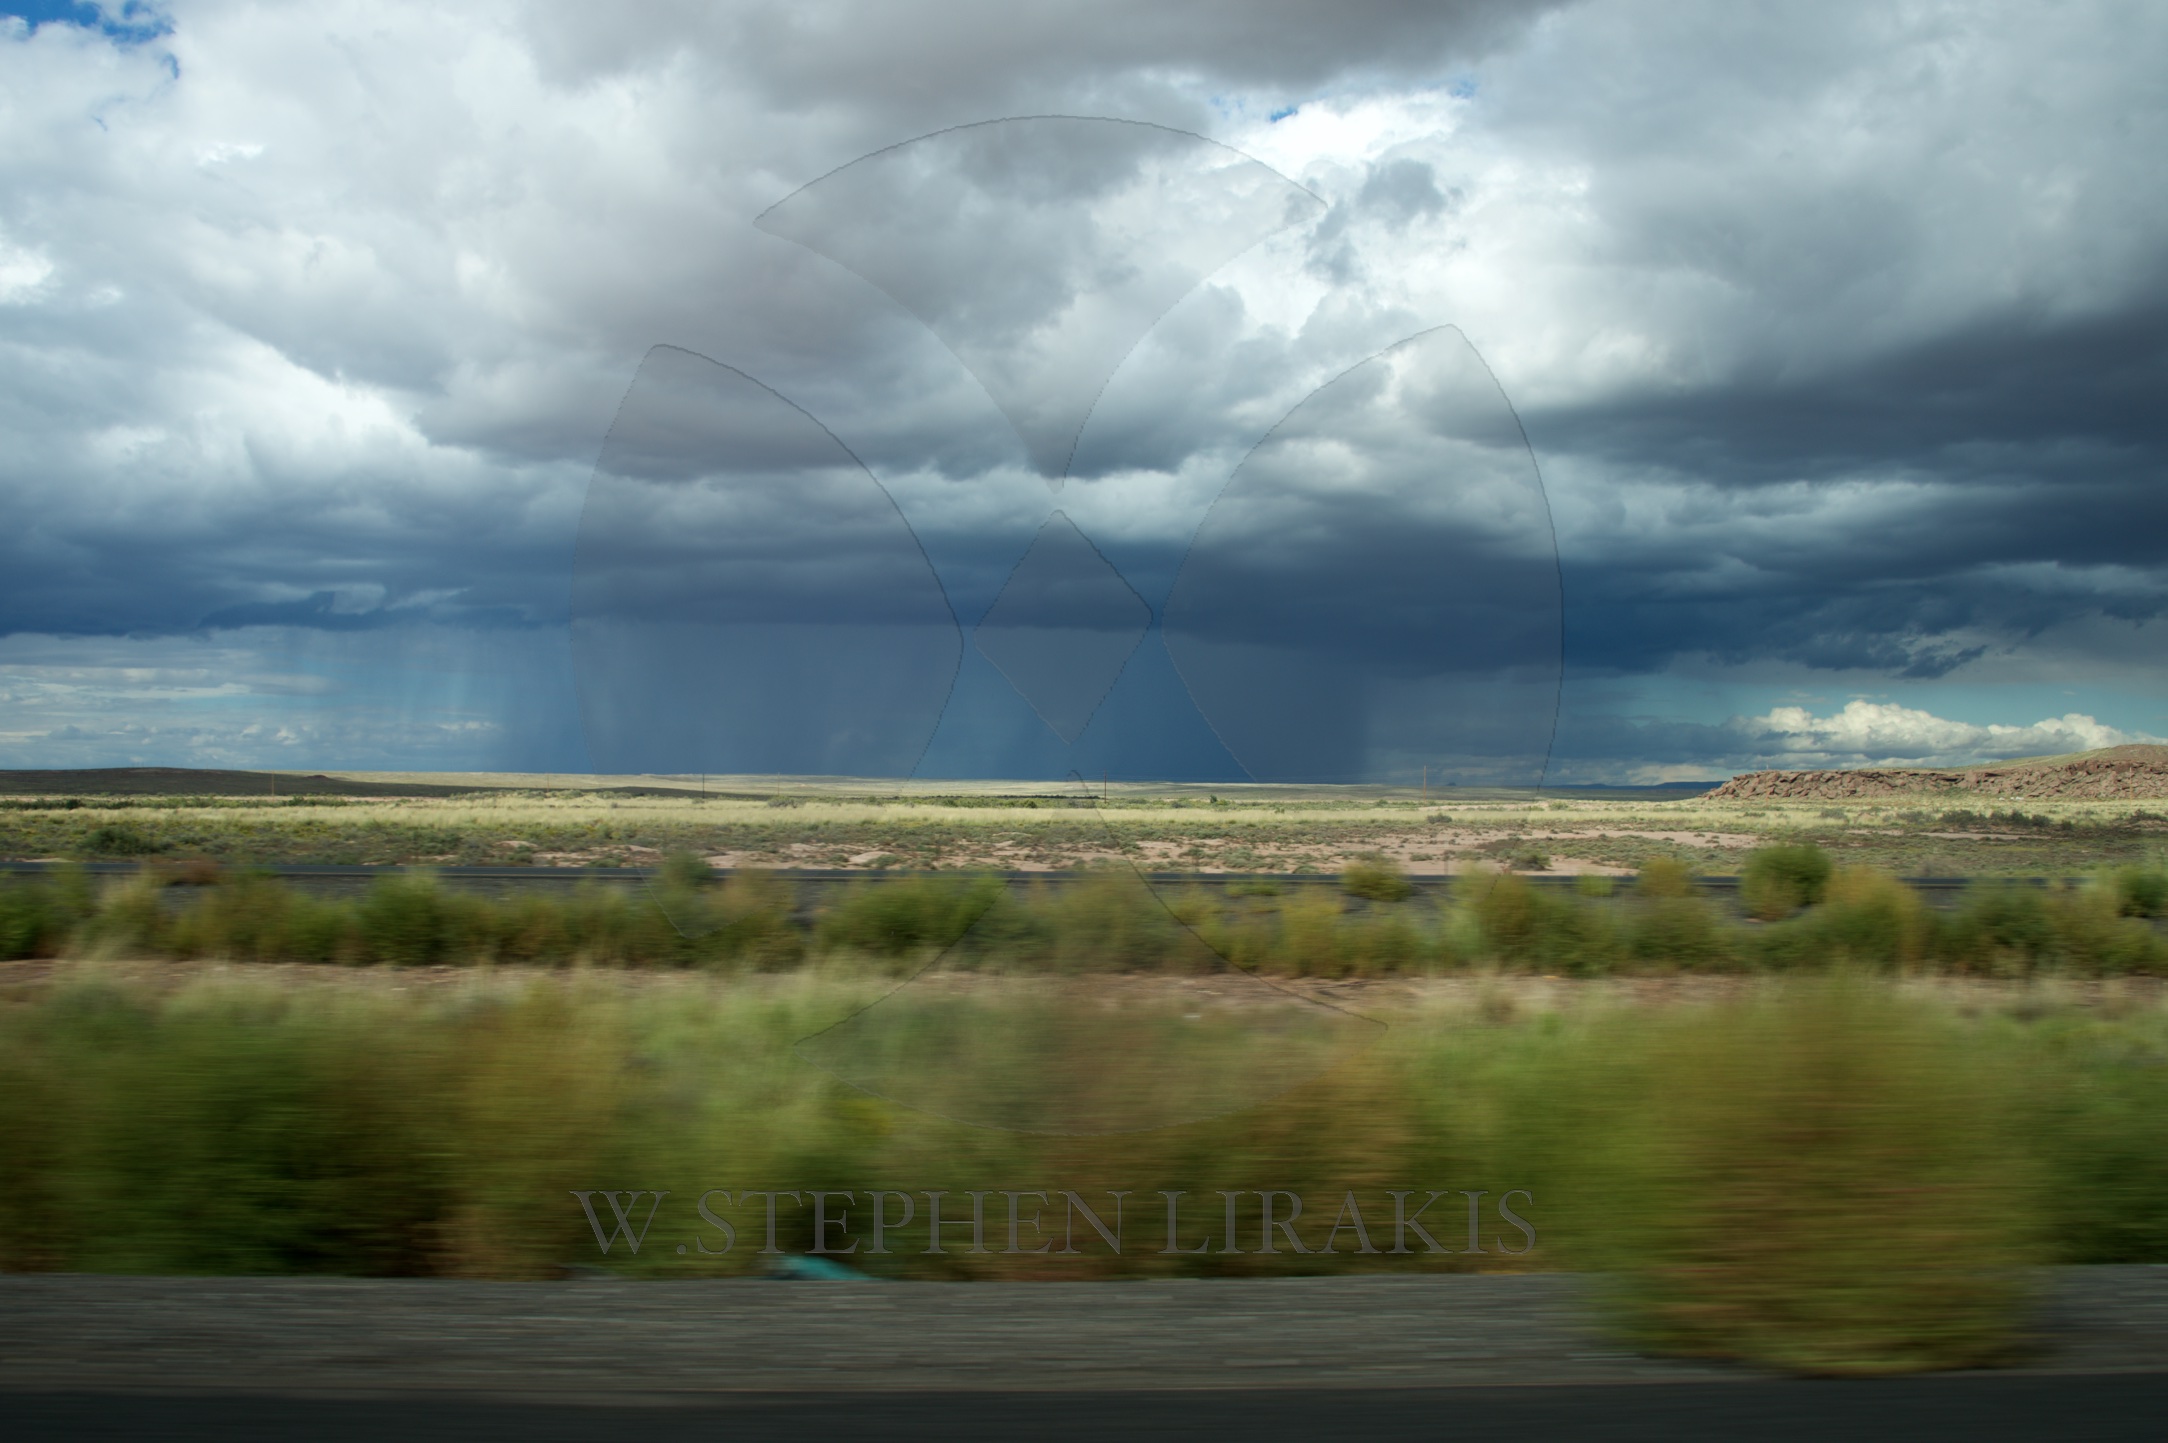
I have many photos like this because I like the mystery of a road that finishes in a vanishing point.
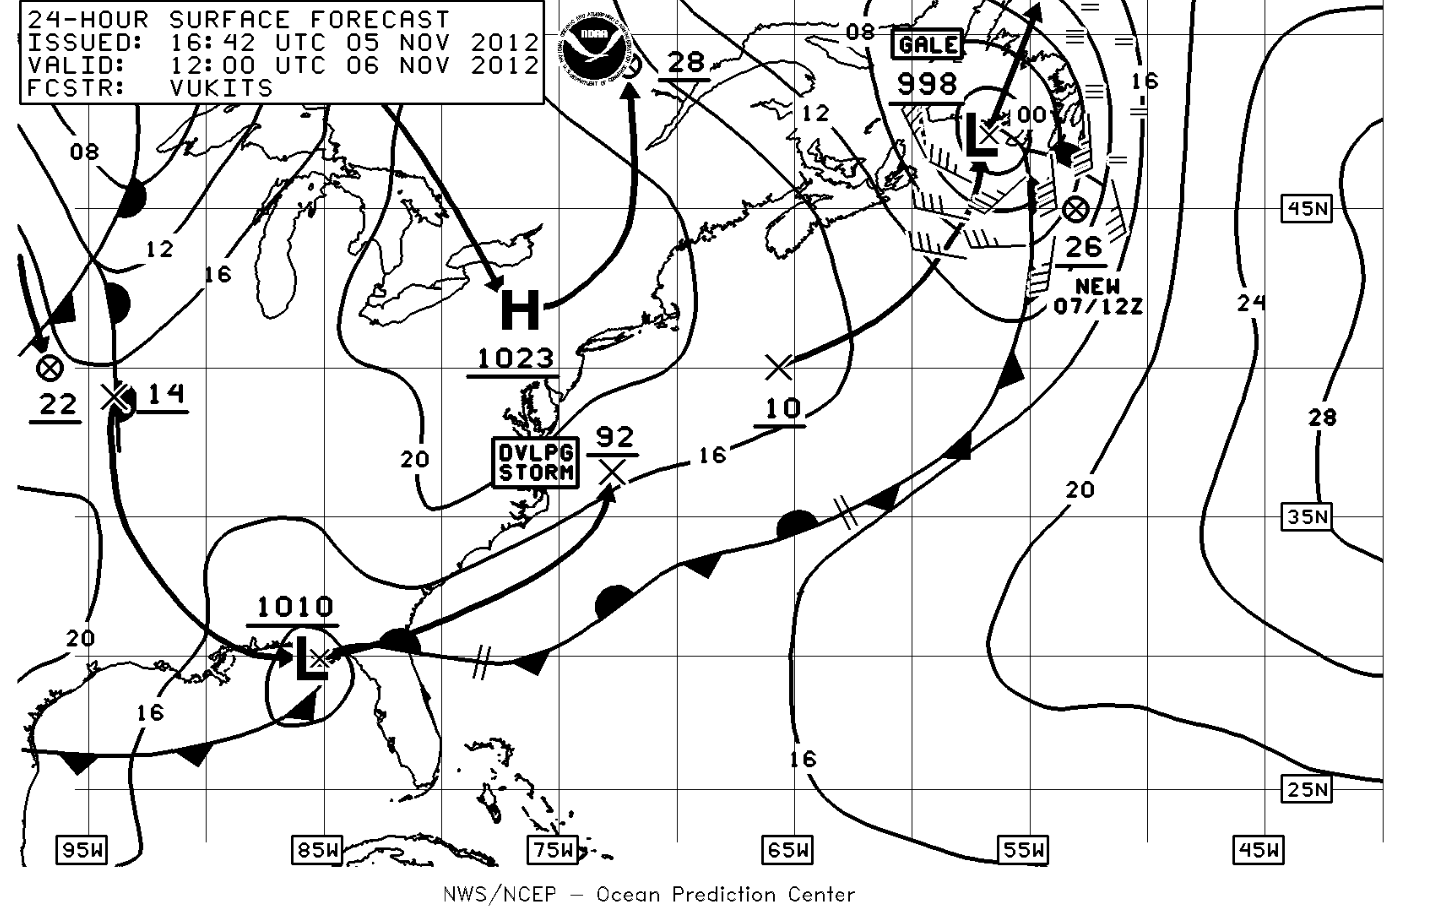
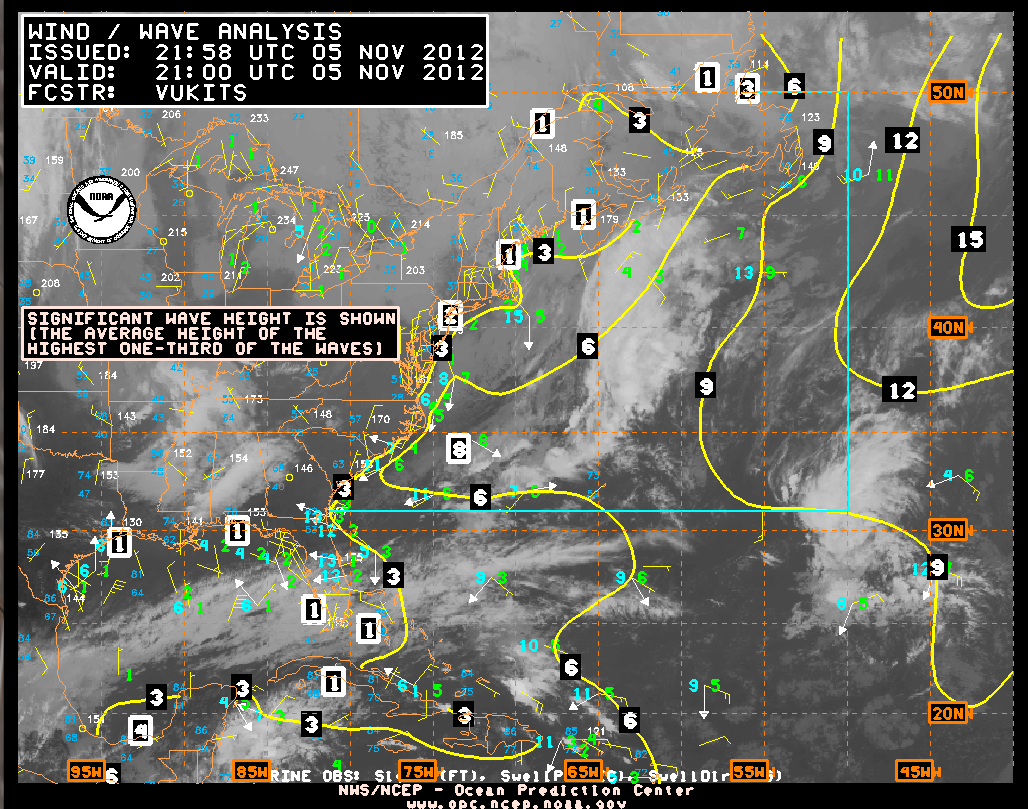
The East Coast is targeted once again by a strong nor’easter; already being called “Son of Sandy”, close on the heels of Hurricane Sandy and before the cleanup is even close to being finished. For some areas it will be years, and things will never again be the same as they were.

Some of the big boats in the race are thinking they might finish the 632 mile Bermuda race in 42 hours.
As the start of the Bermuda Race looms, it occupies more of my thoughts. Have I remembered everything? Did I overlook something on the boat? I want to bring what might be needed, but not bring too much, just contributing to extra unnecessary weight. Back to my recurring thought of reducing thing to the lowest common denominator, as uncomplicated and practical as can be achieved.
Safety at sea is at the back of everyone’s mind.
The decision on where to enter the Gulf Stream will be determined before the start and once we commit to a plan it is quite hard to change. Of course many of these decisions are weather based. What the wind will allow us to do.
My kit for the race is not that different from what I packed for last year’s transatlantic race. Naturally fewer things.
Wishing best of luck and safe race to all competitors; but we are like everyone else, racing to win.


We sailed outside 2.5 miles from “R2” bearing 120 degrees. the wind moved from 206 to 265; from nothing to 12 knots although it was mostly 7 knots. Full of holes and in the words of Commanders’ weather “A tough forecast” which in the end meant only one race was completed.